No products in the cart.
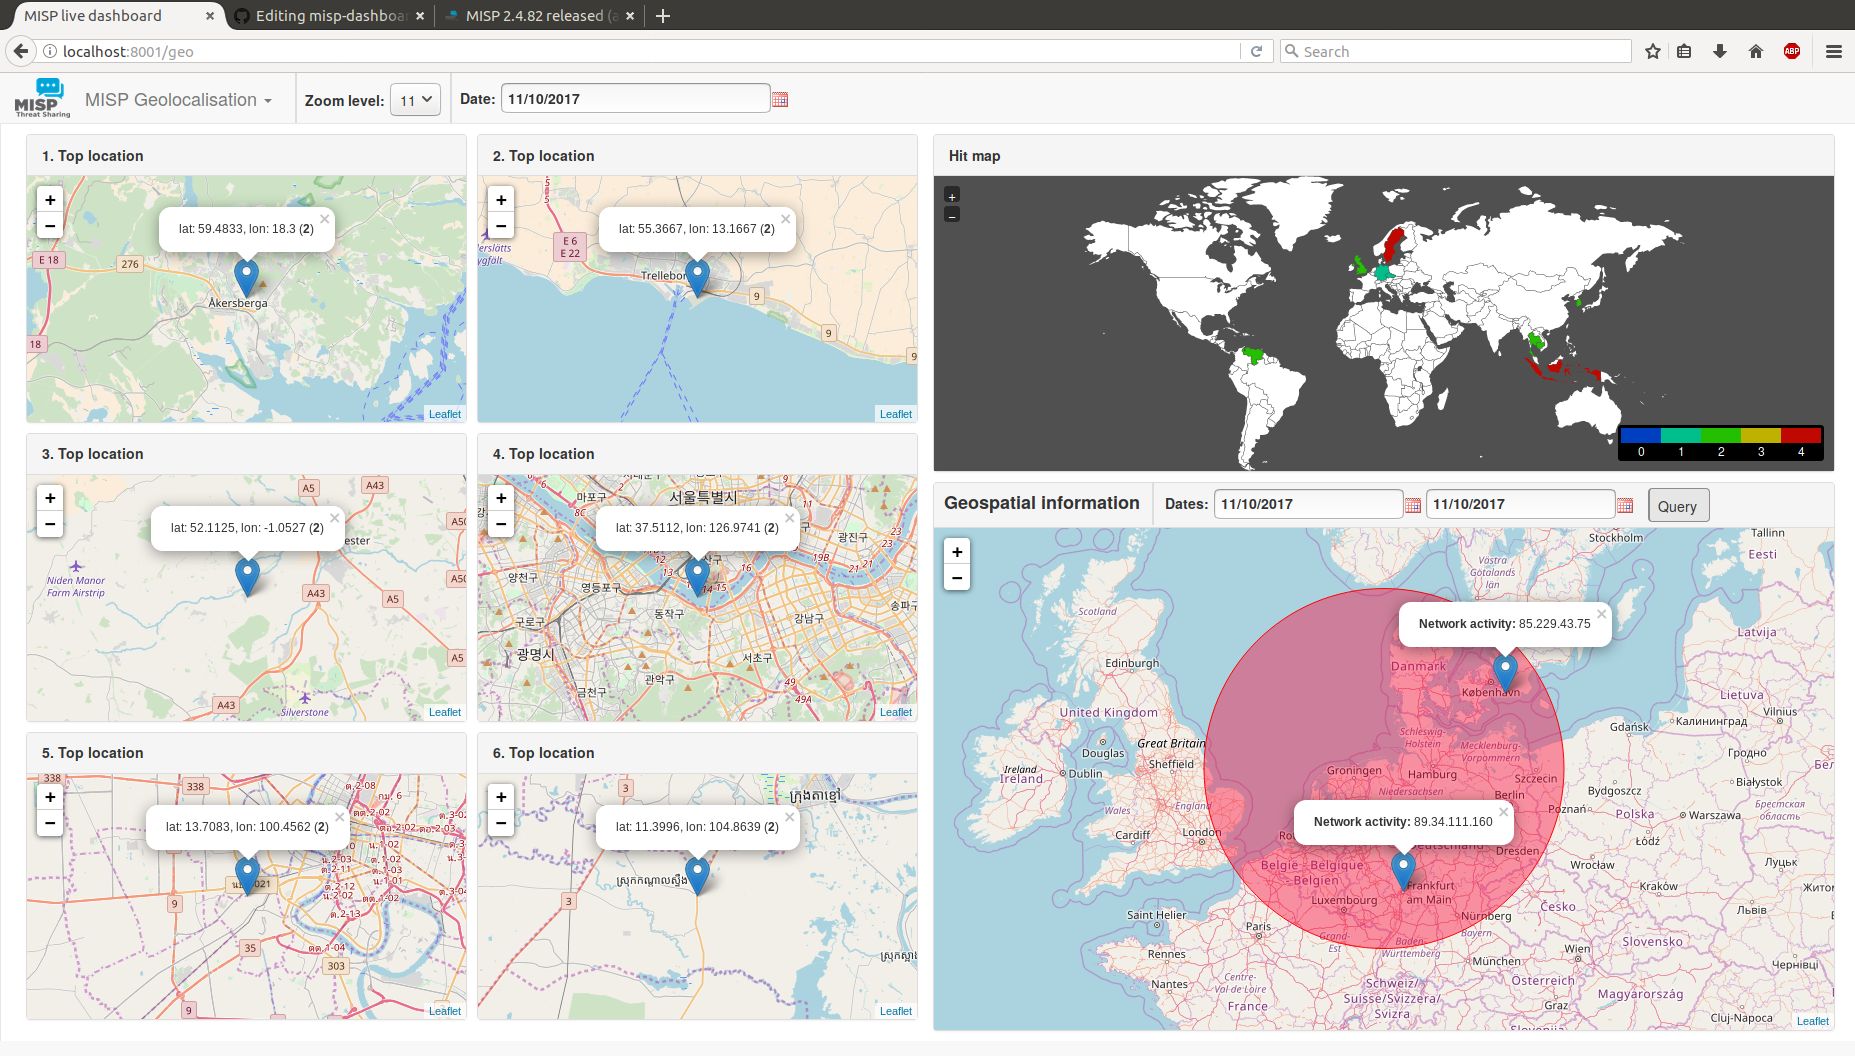
A dashboard showing live data and statistics from the ZMQ feeds of one or more MISP instances. The dashboard can be used as a real-time situational awareness tool to gather threat intelligence information. The misp-dashboard includes a gamification tool to show the contributions of each organisation and how they are ranked over time. The dashboard can be used for SOCs (Security Operation Centers), security teams or during cyber exercises to keep track of what is being processed on your various MISP instances. Features Live Dashboard Possibility to subscribe to multiple ZMQ feeds from different MISP instances Shows immediate contributions made by organisations Displays live resolvable posted geo-locations Geolocalisation Dashboard Provides historical geolocalised information to support security teams, CSIRTs or SOCs in finding threats within their constituency Possibility to get geospatial information from specific regions Contributors Dashboard Shows: The monthly rank of all organisations The last organisation that contributed (dynamic updates)....
Subscribe
0 Comments